The problem
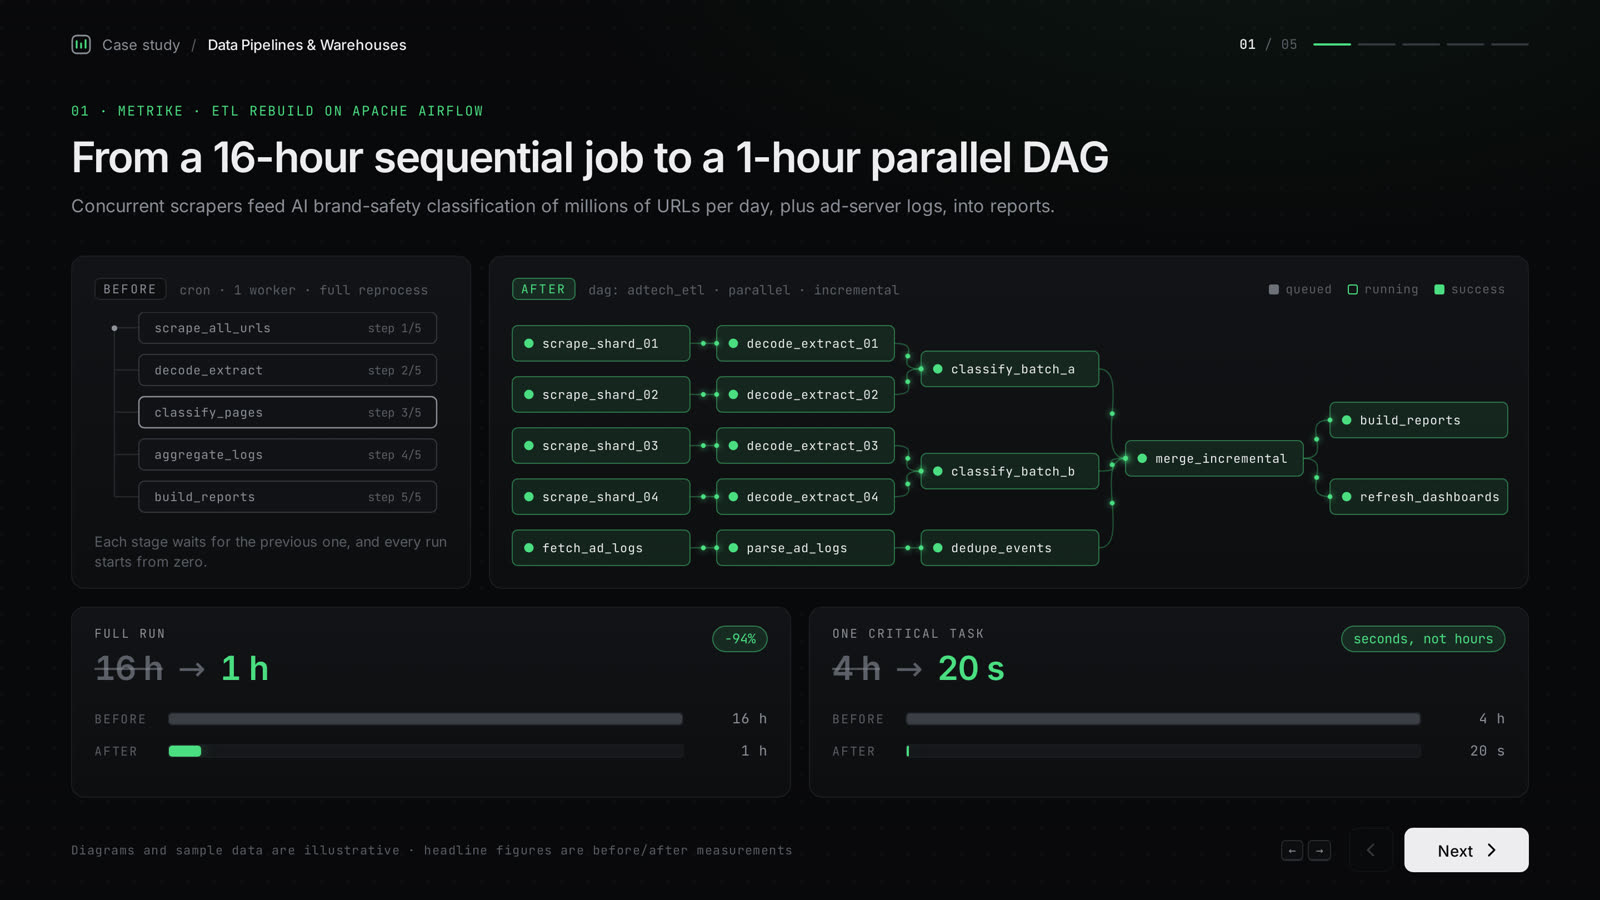
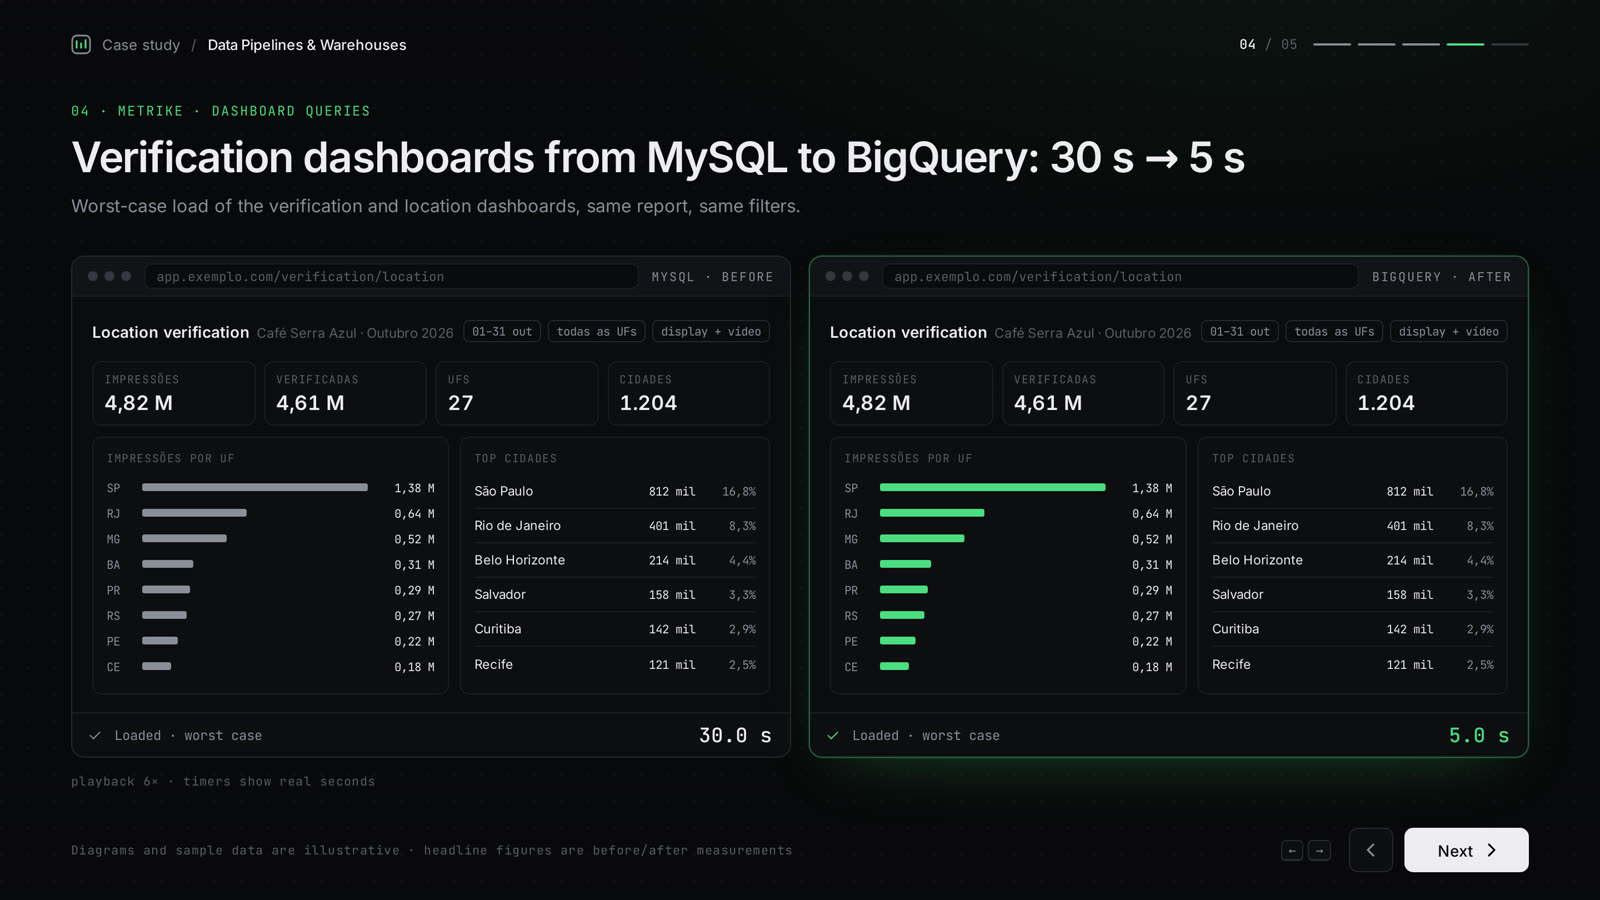
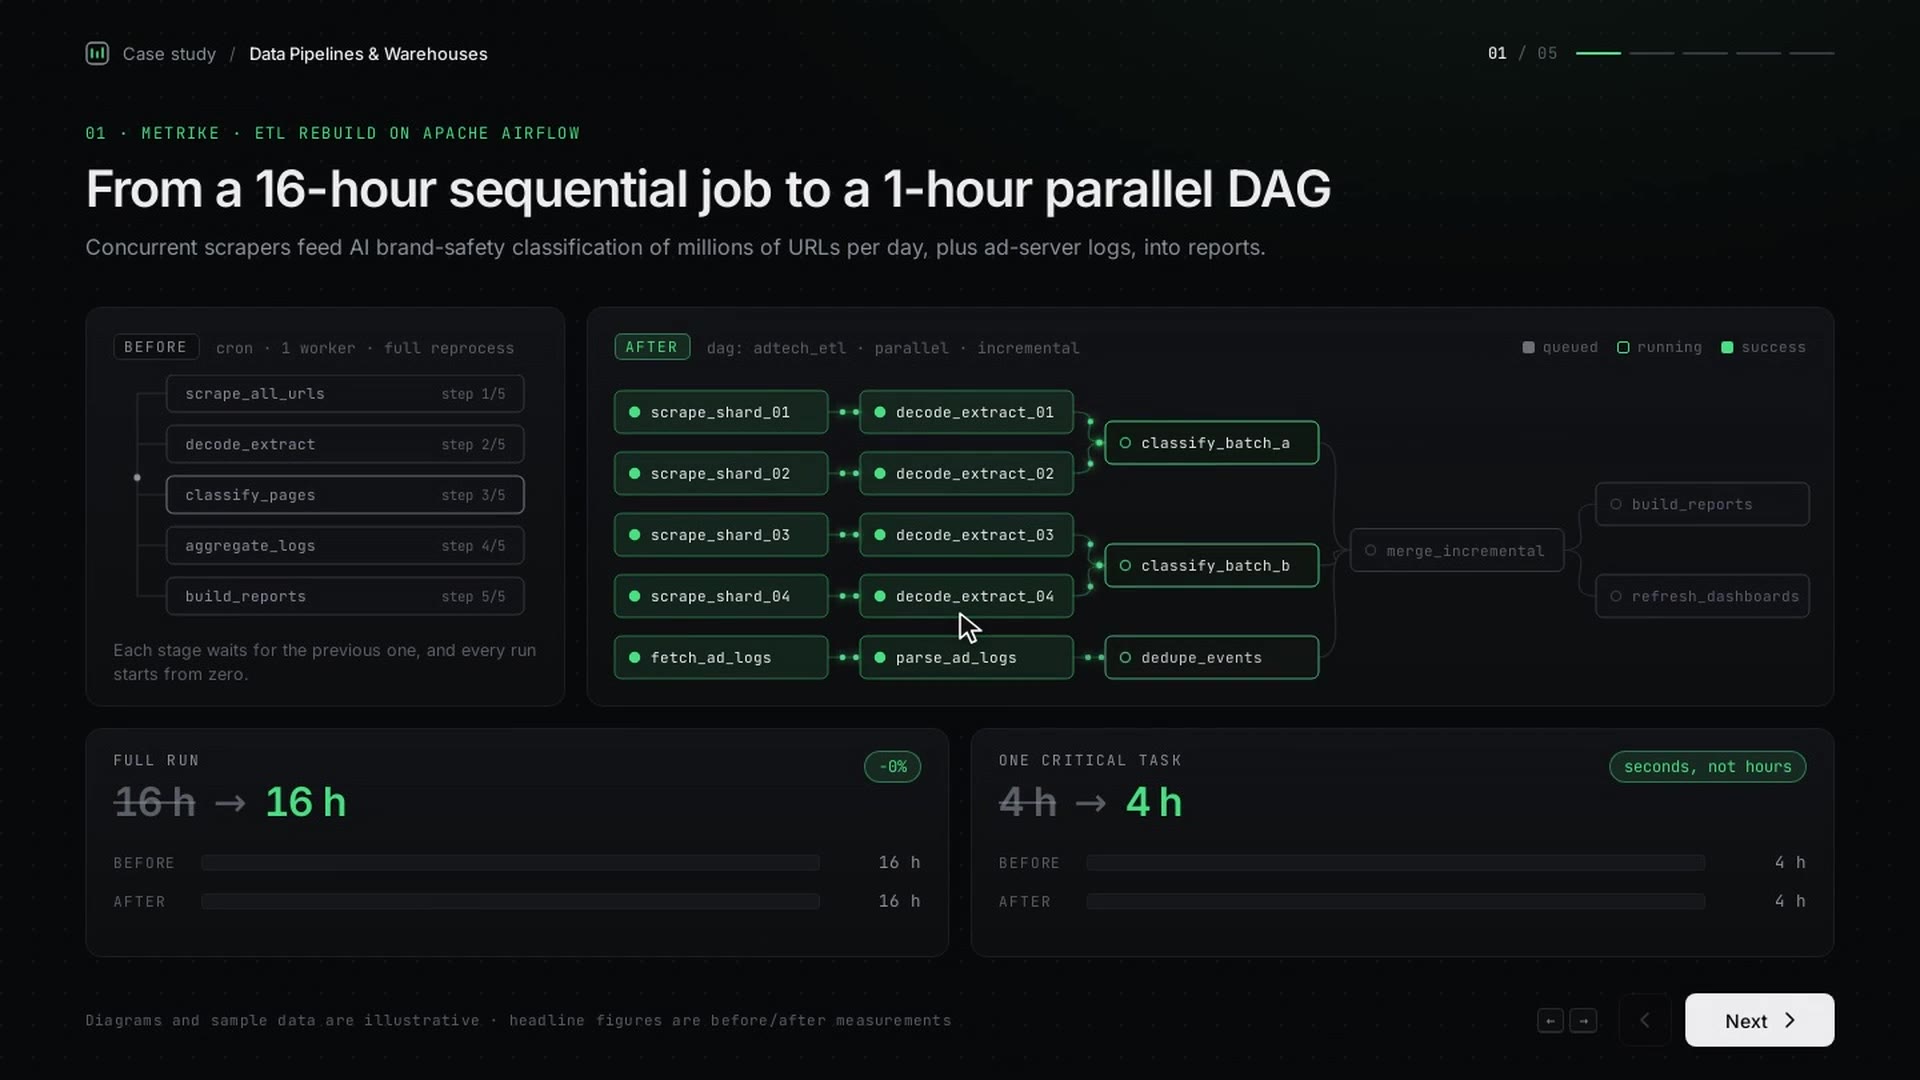
At Metrike, the ad-tech ETL pipeline took 16 hours for a full execution, and one critical task alone took 4 hours. The pipeline feeds AI brand-safety categorization of millions of URLs per day, collected by concurrent scrapers, so a slow run delays every report that depends on it. The verification and location dashboards also read from MySQL, and their worst-case load was about 30 seconds.
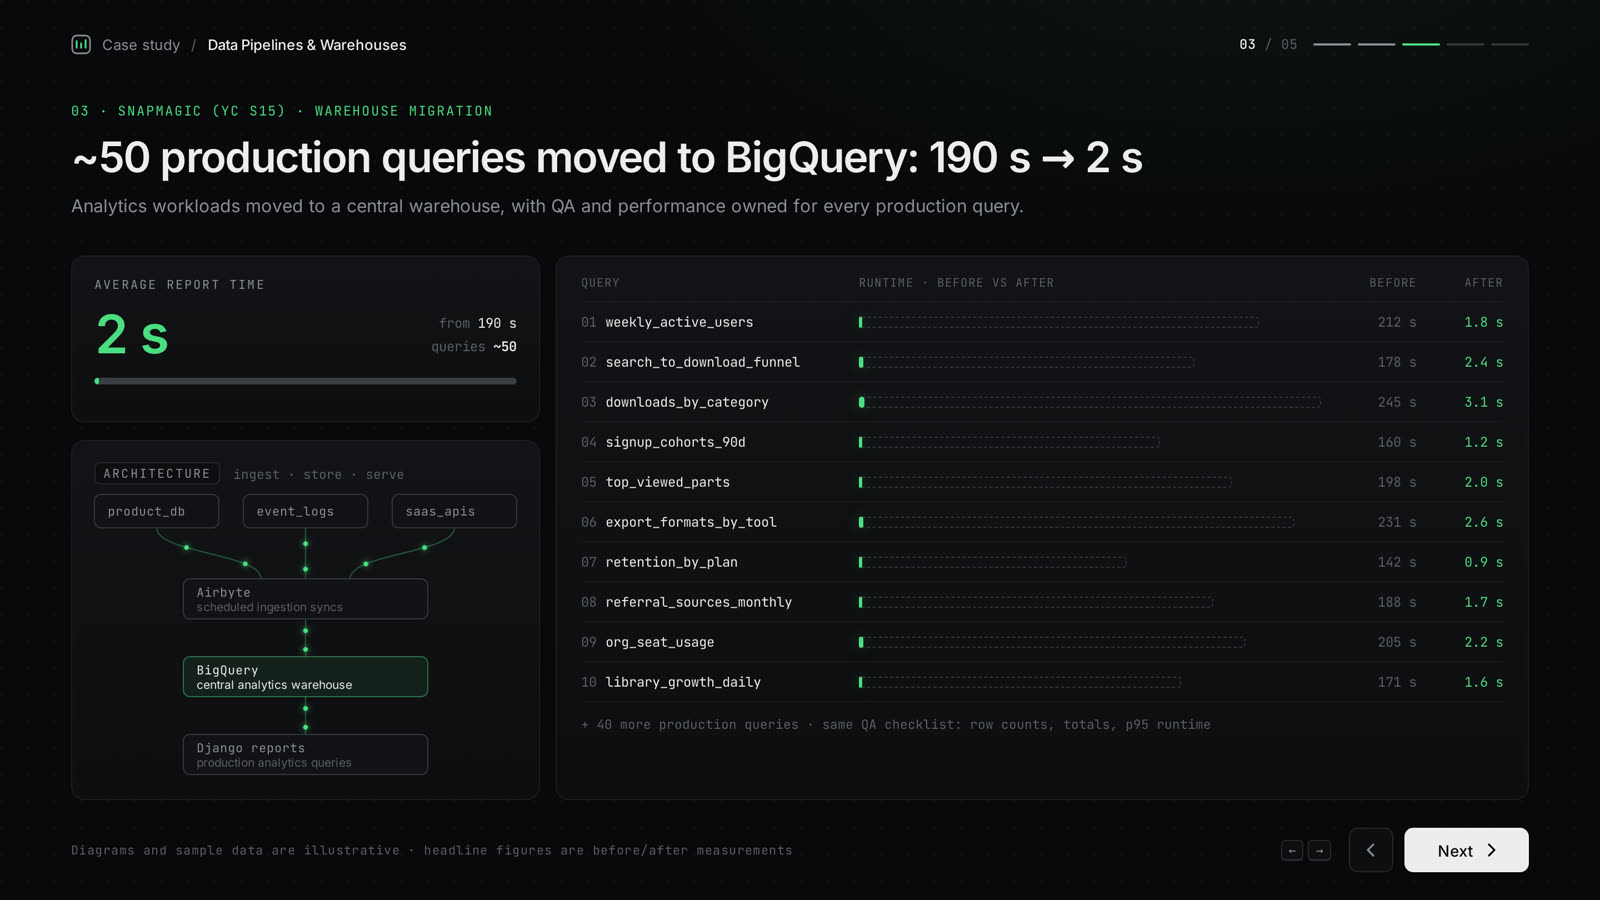
At SnapMagic (YC S15), analytics workloads were not running on a central data warehouse, and reports took about 190 seconds on average.
What I built
- At Metrike, a rebuilt ETL pipeline in Python, Pandas, Apache Airflow, SQLAlchemy, Docker and PostgreSQL, with concurrent scrapers feeding AI brand-safety categorization of millions of URLs per day.
- At Metrike, a migration of the verification and location dashboard queries from MySQL to BigQuery.
- At SnapMagic, the migration of analytics workloads to a central data warehouse (Django, BigQuery, Airbyte, SQL). I led the migration and owned QA and performance for about 50 production queries.
Key decisions
- Treat empty scraped pages as a pipeline bug, not as normal noise. Tracing it showed that missing Brotli decoding left 30.6% of scraped pages empty before AI categorization. It raised no error, so it only showed up when looking at the data itself.
- Serve dashboard and reporting queries from BigQuery: at Metrike by moving the verification and location dashboard queries off MySQL, and at SnapMagic by moving analytics workloads to a central warehouse with Airbyte ingestion.
- At SnapMagic, own QA and performance for each production query during the migration, so the move to the warehouse was checked query by query.
Results
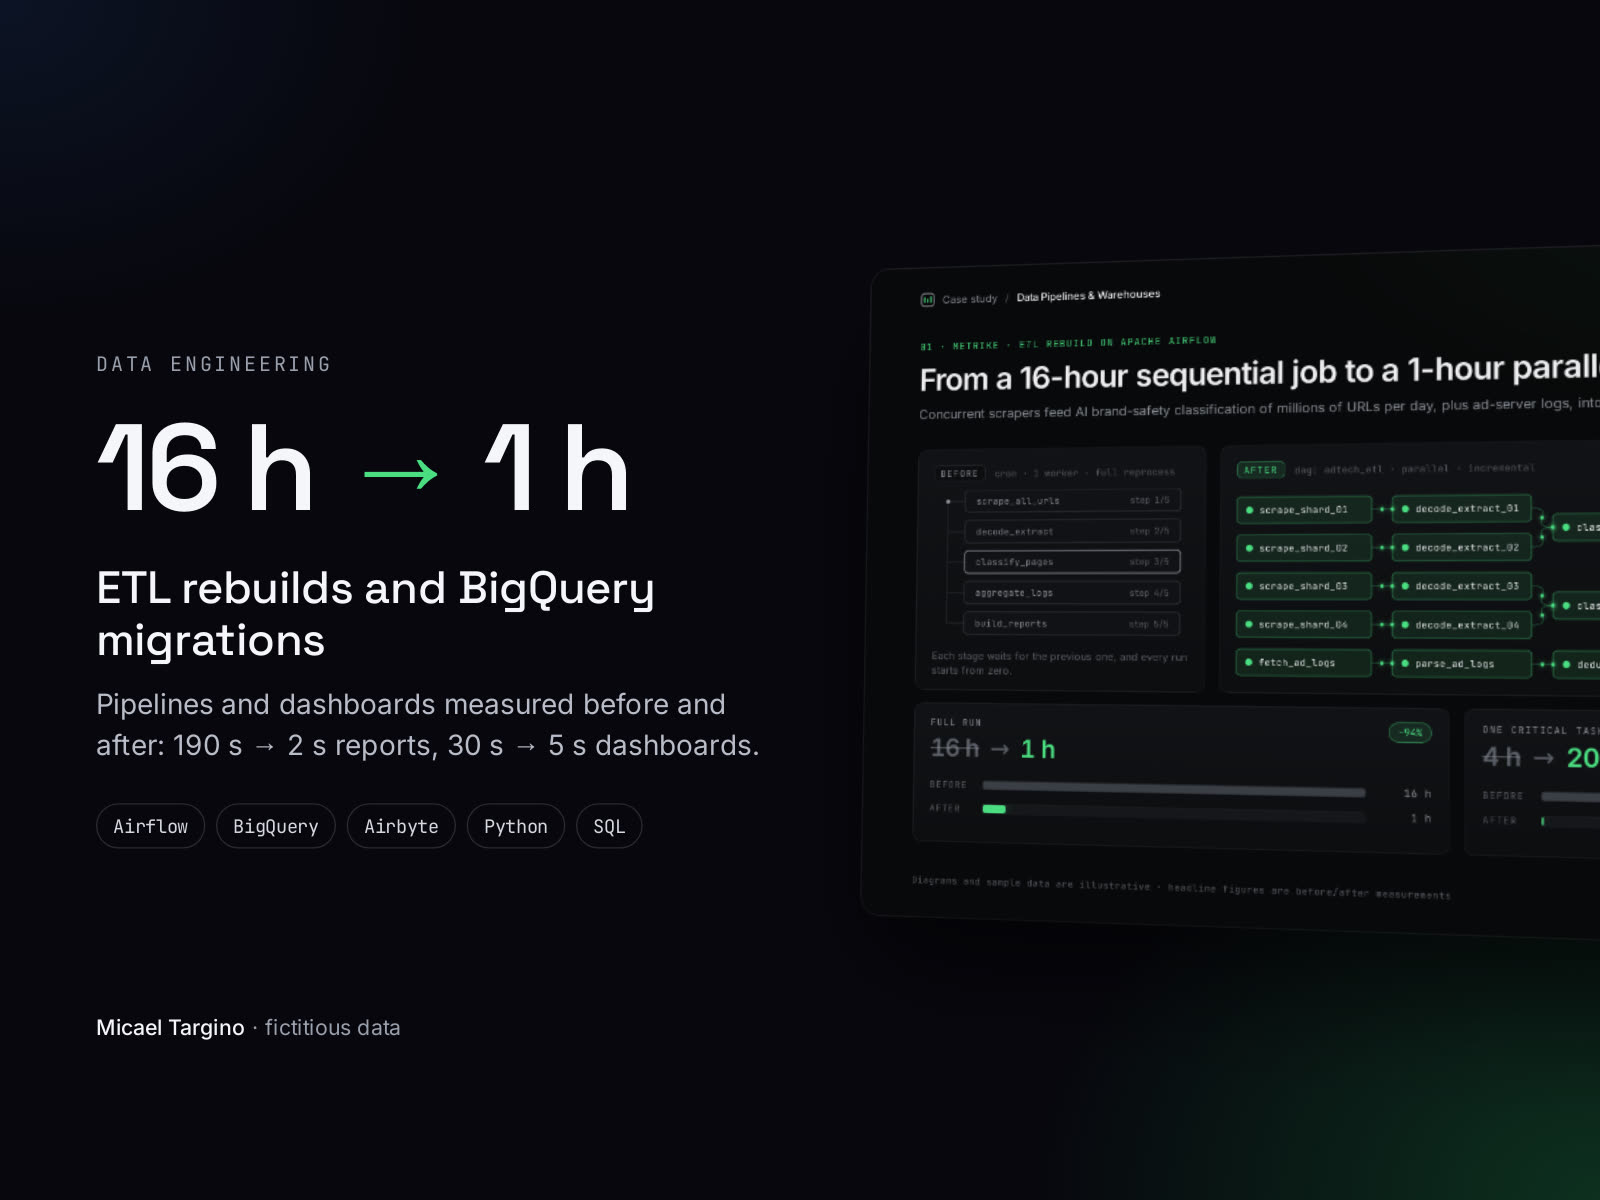
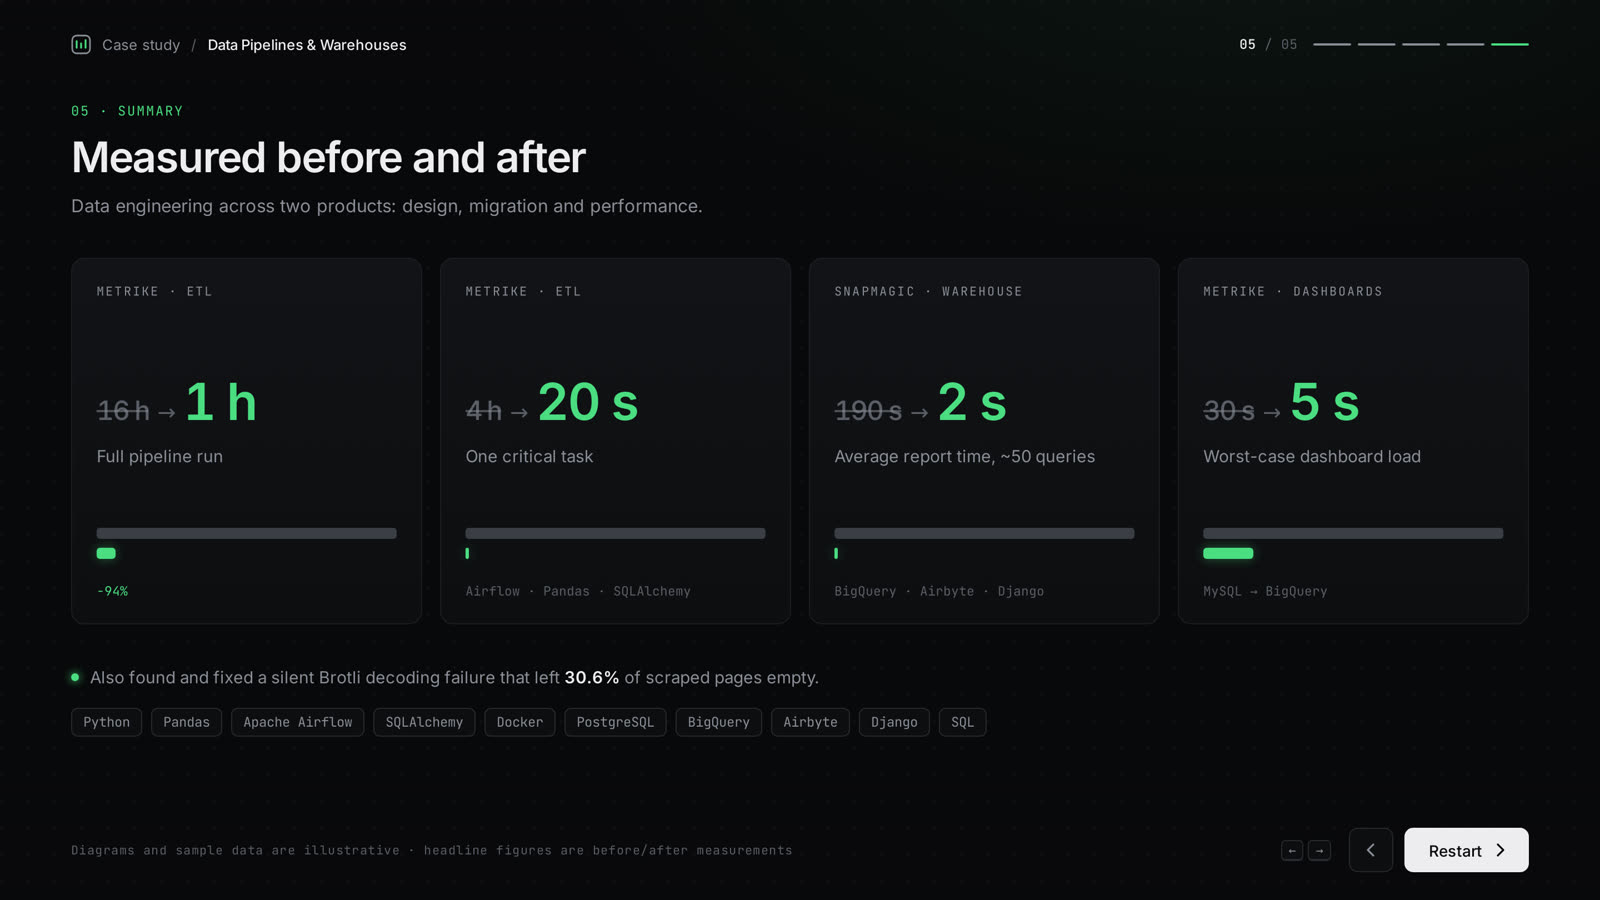
- Metrike ETL full execution: 16 h to 1 h (−94%).
- One critical ETL task: 4 h to 20 s.
- Silent failure fixed: missing Brotli decoding had left 30.6% of scraped pages empty before AI categorization.
- Metrike verification and location dashboards: worst-case load ~30 s to ~5 s after moving from MySQL to BigQuery.
- SnapMagic: average reporting time ~190 s to ~2 s across ~50 production queries.